I recently installed Pi-hole on a spare Raspberry Pi 3.
Pi-hole essentially blocks most advertisements from devices on a network, by
running dnsmasq with a custom set of hosts to block.
Before Pi-hole, I was using dnsmasq with a hosts list generated by a bash script
combining a few other hosts files from the internet. My solution worked, but I
didn't put much effort into it, and it wasn't the easiest thing to maintain.
Pi-hole definitely has more polish to it, and includes a nice web interface for
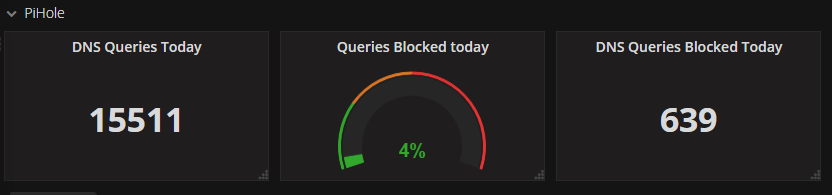
monitoring, logging, and some configuration. One of the first things I noticed
was that the dashboard displays a few stats on the front page. Obviously that
meant I needed to export the same stats to InfluxDB
to graph in Grafana later. This is my
quick solution for doing exactly that.
Pi-hole has a basic "API" at /admin/api.php that returns these stats, which
should make pushing these stats to influxdb easy:
{
  "domains_being_blocked": "103,670",
  "dns_queries_today": "15,511",
  "ads_blocked_today": "639",
  "ads_percentage_today": "4.1"
}
I already have telegraf
installed on the same raspberry pi, so it seemed like the obvious tool to use
for the job. Normally, the httpjson
input plugin would work perfectly. Unfortunately, I ran into a couple issues
right away:
- Values are strings instead of JSON numbers.
- Values have commas in them, requiring extra consideration.
Luckily, telegraf also has an exec
plugin that can be used. I wrote a simple python script to convert those values
to floats, and output the modified json. This is saved to /root/bin/piholestats.py.
#!/usr/bin/python
import json
import requests

# Note: Change localhost to the correct IP if needed.
r = requests.get('http://localhost/admin/api.php')
rstats = json.loads(r.text)

stats = {}
for x in rstats:
    stats[x] = float(rstats[x].replace(',', ''))

print json.dumps(stats)
And then in /etc/telegraf/telegraf.conf, I added this snippet to run the above script.
It will cause the resulting metrics to be named exec_pihole.
# PiHole monitoring
[[inputs.exec]]
    commands = ["/root/bin/piholestats.py"]
    timeout = "10s"
    data_format = "json"
    name_suffix = "_pihole"
After running for a little while, the end result in Grafana:
I'm happy with this solution for now, but I may end up writing something else to
parse pi-hole logs and calculating additional metrics that way.